Main Lend-Lease routes to Russia :
| 1941 | 1942 | 1943 | 1944 | 1945 | Total | |
|---|---|---|---|---|---|---|
| Northern ports | 0.4 | 17.0 | 8.3 | 33.6 | 12.8 | 72.1 |
| Iran | — | 10.1 | 58.9 | 92.6 | 19.4 | 181.0 |
| Far Eastern ports | — | 5.4 | 27.9 | 13.4 | 12.8 | 59.5 |
| Totals | 0.4 | 32.5 | 95.1 | 139.6 | 45.0 | 312.6 |
Lend-Lease Shipments from the Western Hemisphere to the Soviet Union
by Cargo Type, Protocol Period, Route and Tonnage
22 June1941-20 September 1945, in long tons
Source : U.S.State Department, Report on War Aid, 1-8, via Robert Jones
| Cargo Type | Total | Time Period | |||||||||||||||||||||
|---|---|---|---|---|---|---|---|---|---|---|---|---|---|---|---|---|---|---|---|---|---|---|---|
| June 22-Sep 30,1941 Prior to Lend-Lease1 | Oct 1,1941 - June 30,1942 First Protocol | July 1,1942 - June 30,1943 Second Protocol | |||||||||||||||||||||
| Atlantic | Pacific | Total | Atlantic | Pacific | Total | Atlantic | Pacific | Total | |||||||||||||||
| U. S.
S | |||||||||||||||||||||||
| Railroad | 468,532 | — | — | — | — | — | — | — | — | — | |||||||||||||
| Vehicles | 2,290,830 | 1,561 | 14 | 1,575 | 214,148 | 16 | 214,164 | 308,919 | 139,569 | 448,488 | |||||||||||||
| Metals | 3,575,084 | 1,251 | 3,404 | 4,655 | 411,619 | 12,906 | 424,525 | 460,874 | 298,016 | 749,890 | |||||||||||||
| Chemic. | 1,147,764 | 1,033 | 3,693 | 4,726 | 55,542 | 465 | 56,007 | 70,697 | 110,669 | 181,366 | |||||||||||||
| Petrol | 2,113,409 | 9,500 | 120,854 | 130,354 | 132,459 | 35,536 | 167,995 | 54,331 | 159,157 | 213,448 | |||||||||||||
| Machines | 1,247,848 | 280 | 15,575 | 15,855 | 29,116 | 576 | 29,692 | 28,604 | 139,864 | 168,468 | |||||||||||||
| Food | 4,464,977 | 19 | 3,899 | 3,918 | 129,999 | 175,038 | 305,037 | 294,236 | 703,547 | 997,783 | |||||||||||||
| Others | 1,221,307 | 1,258 | 1,365 | 2,623 | 74,281 | 1,943 | 76,224 | 167,657 | 70,119 | 237,776 | |||||||||||||
| Canadian + British supplies | 968,648 | — | — | — | 137,841 | 8,770 | 146,611 | 45,898 | 11,142 | 57,040 | |||||||||||||
| Other Sources | 2,494 | — | 2,494 | 2,494 | — | — | — | — | — | — | |||||||||||||
| Total | 17,500,933 | 14,902 | 151,298 | 166,200 | 1,185,005 | 235,250 | 1,420,255 | 1,431,216 | 1,623,083 | 3,054,299 | |||||||||||||
| Cargo Type | Total | Time Period | |||||||||||||||||||||
|---|---|---|---|---|---|---|---|---|---|---|---|---|---|---|---|---|---|---|---|---|---|---|---|
| July 1,1943 - June 30,1944 Third Protocol | July 1,1944 - May 12,1945 Fourth Protocol | May 13,1945 - Sep 2,1945 Milepost agrrement | |||||||||||||||||||||
| Atlantic | Pacific | Total | Atlantic | Pacific | Total | Atlantic | Pacific | Total | |||||||||||||||
| U. S.
S | |||||||||||||||||||||||
| Railroad | 468,532 | 39,455 | 31,011 | 70,466 | 146,901 | 208,838 | 355,739 | 9,067 | 32,313 | 41,380 | |||||||||||||
| Vehicles | 2,290,830 | 641,618 | 100,719 | 742,337 | 531,235 | 114,035 | 645,270 | 28,353 | 209,764 | 238,117 | |||||||||||||
| Metals | 3,575,084 | 699,971 | 312,430 | 1,012,401 | 654,164 | 468,432 | 1,122,596 | 37,988 | 211,214 | 249,202 | |||||||||||||
| Chemic. | 1,147,764 | 288,848 | 219,301 | 448,149 | 206,670 | 192,676 | 399,346 | 7,279 | 50,509 | 57,788 | |||||||||||||
| Petrol | 2,113,409 | 45,272 | 401,434 | 446,706 | 250,455 | 498,285 | 748,740 | 34,496 | 371,670 | 406,166 | |||||||||||||
| Machines | 1,247,848 | 182,335 | 305,166 | 487,501 | 232,585 | 243,060 | 475,645 | 30,465 | 38,073 | 68,538 | |||||||||||||
| Food | 4,464,977 | 936,541 | 798,260 | 1,734,801 | 553,674 | 603,699 | 1,157,373 | 22,594 | 235,607 | 258,201 | |||||||||||||
| Others | 1,221,307 | 350,517 | 122,451 | 472,968 | 188,986 | 121,515 | 310,501 | 13,972 | 103,235 | 117,207 | |||||||||||||
| Canadian + British supplies | 968,648 | 31,741 | 298,652 | 330,393 | 51,863 | 265,707 | 317,570 | 7,613 | 97,487 | 105,100 | |||||||||||||
| Other Sources | 2,494 | — | — | — | — | — | — | — | — | — | |||||||||||||
| Total | 17,500,933 | 3,216,298 | 2,589,424 | 5,745,722 | 2,816,533 | 2,716,247 | 5,532,780 | 191,827 | 1,349,872 | 1,541,699 | |||||||||||||
| Cargo Type | Total | Time Period | |||||||||||||||||||||
|---|---|---|---|---|---|---|---|---|---|---|---|---|---|---|---|---|---|---|---|---|---|---|---|
| Sep 3,1945 - Sep 20,1945 Period of termination | |||||||||||||||||||||||
| Atlantic | Pacific | Total | |||||||||||||||||||||
| U. S.
S | |||||||||||||||||||||||
| Railroad | 468,532 | — | 947 | 947 | |||||||||||||||||||
| Vehicles | 2,290,830 | — | 879 | 879 | |||||||||||||||||||
| Metals | 3,575,084 | 2,801 | 9,014 | 11,815 | |||||||||||||||||||
| Chemic. | 1,147,764 | 39 | 343 | 382 | |||||||||||||||||||
| Petrol | 2,113,409 | — | — | — | |||||||||||||||||||
| Machines | 1,247,848 | 819 | 1,330 | 2,149 | |||||||||||||||||||
| Food | 4,464,977 | 1,989 | 5,875 | 7,864 | |||||||||||||||||||
| Others | 1,221,307 | 1,325 | 2,683 | 4,008 | |||||||||||||||||||
| Canadian + British supplies | 968,648 | 2,331 | 9,603 | 11,934 | |||||||||||||||||||
| Other Sources | 2,494 | — | — | — | |||||||||||||||||||
| Total | 17,500,933 | 9,304 | 30,674 | 39,978 | |||||||||||||||||||
1 Not shipped under Lend-Lease, but under $10,000,000 Treasury Department advance, the $50,000,000 Defense Supplies Corporation advance, and other arrangements.
SUMMARY:
17,500,900 long tons shipped from the Western Hemisphere.
16,429,800 long tons (94 per cent) shipped from the United States.
Of the supplies sent to the Soviet Union from the Western Hemisphere from June 22, 1941 to September 20, 1945, 98 per cent was of Lend-Lease origin.
The total value of these shipments is reported at approximately $10,200,000,000.
In addition, supply services such as ocean transport on American vessels, repairs to Soviet ships, ship supplies, bunkers, port dues, training of Soviet crews for Lend-Lease aircraft, and ships were valued at approximately $700,000,000.
Total Cargo shipped from the Western Hemisphere to the Soviet Union by Time Period, Route of Delivery and Tonnage
Source : U.S.State Department, Report on War Aid, 1-8, via Vail Motter
| Year and Month b | All Routes | Persian Gulf | Soviet Far East | North Russia | Black Sea | Soviet Artic | |||||
|---|---|---|---|---|---|---|---|---|---|---|---|
| Tons | Percent of Total | Tons | Percent of Total | Tons | Percent of Total | Tons | Percent of Total | Tons | Percent of Total | ||
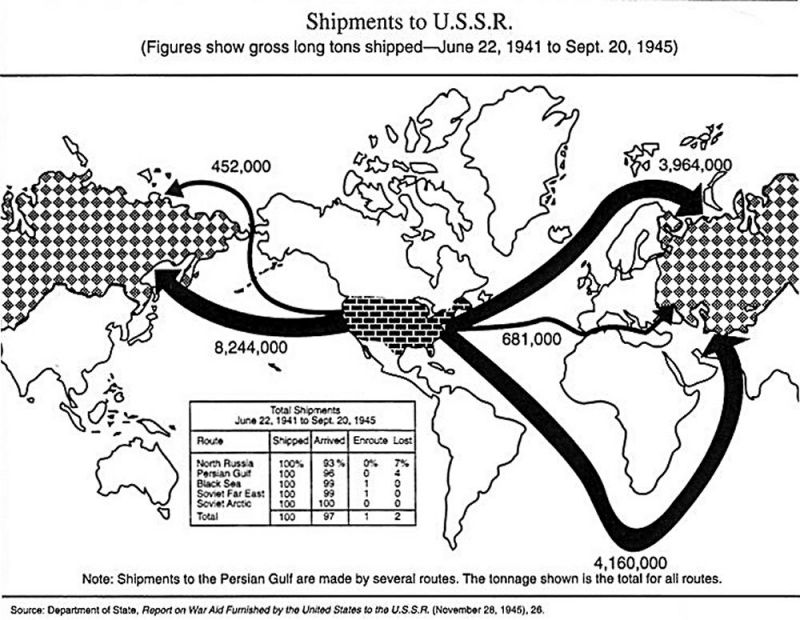
| Total | 17,499,861 | 4,159,117 | 23.8 | 8,243,397 | 47.1 | 3,964,231 | 22.7 | 680,723 | 3.9 | 452,393 | 2.5 |
| Year and Month b | All Routes | Persian Gulf | Soviet Far East | North Russia | Black Sea | Soviet Artic | |||||
| Tons | Percent of Total | Tons | Percent of Total | Tons | Percent of Total | Tons | Percent of Total | Tons | Percent of Total | ||
| 1941 | 360,778 | 13,502 | 3.7 | 193,299 | 53.6 | 153,977 | 42.7 | 0 | 0.0 | 0 | 0.0 |
| June | 2,977 | 0 | 0.0 | 2,988 | 100.0 | 0 | 0.0 | 0 | 0.0 | 0 | 0.0 |
| July | 27,567 | 0 | 0.0 | 27,567 | 100.0 | 0 | 0.0 | 0 | 0.0 | 0 | 0.0 |
| August | 97,483 | 0 | 0.0 | 93,113 | 95.5 | 4,370 | 4.5 | 0 | 0.0 | 0 | 0.0 |
| September | 38,161 | 0 | 0.0 | 27,629 | 72.4 | 10,532 | 27.6 | 0 | 0.0 | 0 | 0.0 |
| October | 65,513 | 0 | 0.0 | 17,161 | 26.2 | 48,352 | 73.8 | 0 | 0.0 | 0 | 0.0 |
| November | 57,604 | 2,972 | 5.2 | 13,559 | 23.5 | 41,073 | 71.3 | 0 | 0.0 | 0 | 0.0 |
| December | 71,462 | 10,530 | 14.7 | 11,282 | 15.8 | 49,650 | 69.5 | 0 | 0.0 | 0 | 0.0 |
| Year and Month b | All Routes | Persian Gulf | Soviet Far East | North Russia | Black Sea | Soviet Artic | |||||
|---|---|---|---|---|---|---|---|---|---|---|---|
| Tons | Percent of Total | Tons | Percent of Total | Tons | Percent of Total | Tons | Percent of Total | Tons | Percent of Total | ||
| 1942 | 2,453,097 | 705,259 | 28.8 | 734,020 | 29.9 | 949,711 | 38.7 | 0 | 0.0 | 64,107 | 2.6 |
| January | 88,597 | 34 | (c) | 26,047 | 29.4 | 62,516 | 70.6 | 0 | 0.0 | 0 | 0.0 |
| February | 92,670 | 5,282 | 5.7 | 22,206 | 24.0 | 65,182 | 70.3 | 0 | 0.0 | 0 | 0.0 |
| March | 213,999 | 17,754 | 8.3 | 25,555 | 11.9 | 170,690 | 79.8 | 0 | 0.0 | 0 | 0.0 |
| April | 441,968 | 21,173 | 4.8 | 38,441 | 8.7 | 382,354 | 86.5 | 0 | 0.0 | 0 | 0.0 |
| May | 194,747 | 86,978 | 44.7 | 33,035 | 17.0 | 74,734 | 38.3 | 0 | 0.0 | 0 | 0.0 |
| June | 193,695 | 91,012 | 47.0 | 30,288 | 15.6 | 54,720 | 28.3 | 0 | 0.0 | 17,675 | 9.1 |
| July | 183,362 | 62,492 | 34.1 | 63,313 | 34.5 | 13,351 | 7.3 | 0 | 0.0 | 44,206 | 24.1 |
| August | 215,543 | 65,598 | 30.4 | 78,616 | 36.5 | 69,013 | 32.0 | 0 | 0.0 | 2,226 | 1.1 |
| September | 179,430 | 72,057 | 40.2 | 79,604 | 44.4 | 27,769 | 15.4 | 0 | 0.0 | 0 | 0.0 |
| October | 229,331 | 121,272 | 52.9 | 108,059 | 47.1 | 0 | 0.0 | 0 | 0.0 | 0 | 0.0 |
| November | 176,911 | 70,430 | 39.8 | 106,481 | 60.2 | 0 | 0.0 | 0 | 0.0 | 0 | 0.0 |
| December | 242,934 | 91,177 | 37.5 | 122,375 | 50.4 | 29,382 | 12.1 | 0 | 0.0 | 0 | 0.0 |
| Year and Month b | All Routes | Persian Gulf | Soviet Far East | North Russia | Black Sea | Soviet Artic | |||||
|---|---|---|---|---|---|---|---|---|---|---|---|
| Tons | Percent of Total | Tons | Percent of Total | Tons | Percent of Total | Tons | Percent of Total | Tons | Percent of Total | ||
| 1943 | 4,794,545 | 1,606,979 | 33.5 | 2,388,577 | 49.8 | 681,043 | 14.2 | 0 | 0.0 | 117,946 | 2.5 |
| January | 258,055 | 86,836 | 33.7 | 97,671 | 37.8 | 73,548 | 28.5 | 0 | 0.0 | 0 | 0.0 |
| February | 342,055 | 40,071 | 11.8 | 129,004 | 37.7 | 172,980 | 50.5 | 0 | 0.0 | 0 | 0.0 |
| March | 263,209 | 131,277 | 49.9 | 122,646 | 46.6 | 9,286 | 3.5 | 0 | 0.0 | 0 | 0.0 |
| April | 337,572 | 143,808 | 42.6 | 193,764 | 57.4 | 0 | 0.0 | 0 | 0.0 | 0 | 0.0 |
| May | 349,259 | 121,002 | 34.6 | 216,380 | 62.0 | 0 | 0.0 | 0 | 0.0 | 11,877 | 3.4 |
| June | 275,622 | 28,786 | 10.4 | 230,183 | 83.5 | 0 | 0.0 | 0 | 0.0 | 16,653 | 6.1 |
| July | 336,094 | 126,184 | 37.5 | 152,215 | 45.3 | 0 | 0.0 | 0 | 0.0 | 57,695 | 17.2 |
| August | 469,961 | 177,153 | 37.7 | 261,087 | 55.6 | 0 | 0.0 | 0 | 0.0 | 31,721 | 6.7 |
| September | 511,365 | 197,886 | 38.7 | 313,479 | 61.3 | 0 | 0.0 | 0 | 0.0 | 0 | 0.0 |
| October | 439,655 | 192,744 | 43.8 | 180,872 | 41.4 | 66,039 | 15.1 | 0 | 0.0 | 0 | 0.0 |
| November | 568,620 | 194,775 | 34.2 | 228,964 | 40.3 | 144,881 | 25.5 | 0 | 0.0 | 0 | 0.0 |
| December | 643,078 | 166,457 | 25.9 | 262,312 | 40.8 | 214,309 | 33.3 | 0 | 0.0 | 0 | 0.0 |
| Year and Month b | All Routes | Persian Gulf | Soviet Far East | North Russia | Black Sea | Soviet Artic | |||||
|---|---|---|---|---|---|---|---|---|---|---|---|
| Tons | Percent of Total | Tons | Percent of Total | Tons | Percent of Total | Tons | Percent of Total | Tons | Percent of Total | ||
| 1944 | 6,217,622 | 1,788,864 | 28.8 | 2,848,181 | 45.8 | 1,452,775 | 23.4 | 0 | 0.0 | 127,802 | 2.0 |
| January | 599,239 | 201,713 | 33.7 | 176,170 | 29.4 | 221,356 | 36.9 | 0 | 0.0 | 0 | 0.0 |
| February | 341,158 | 114,161 | 33.5 | 100,017 | 29.3 | 126,980 | 37.2 | 0 | 0.0 | 0 | 0.0 |
| March | 351,751 | 150,500 | 42.8 | 91,299 | 26.0 | 109,952 | 31.2 | 0 | 0.0 | 0 | 0.0 |
| April | 408,870 | 274,791 | 67.2 | 134,079 | 32.8 | 0 | 0.0 | 0 | 0.0 | 0 | 0.0 |
| May | 553,376 | 289,070 | 52.2 | 264,306 | 47.8 | 0 | 0.0 | 0 | 0.0 | 0 | 0.0 |
| June | 522,556 | 187,349 | 35.9 | 307,224 | 58.8 | 0 | 0.0 | 0 | 0.0 | 27,983 | 5.3 |
| July | 624,578 | 127,393 | 20.4 | 275,761 | 44.2 | 155,760 | 24.9 | 0 | 0.0 | 65,664 | 10.5 |
| August | 561,533 | 36,437 | 6.5 | 308,614 | 55.0 | 185,562 | 33.0 | 0 | 0.0 | 30,920 | 5.5 |
| September | 579,860 | 87,861 | 15.2 | 298,208 | 51.4 | 190,556 | 32.9 | 0 | 0.0 | 3,235 | 0.5 |
| October | 545,414 | 156,228 | 28.6 | 309,441 | 56.8 | 79,745 | 14.6 | 0 | 0.0 | 0 | 0.0 |
| November | 564,628 | 95,864 | 17.0 | 313,916 | 55.6 | 154,848 | 27.4 | 0 | 0.0 | 0 | 0.0 |
| December | 564,659 | 67,497 | 12.0 | 269,146 | 47.7 | 228,016 | 40.3 | 0 | 0.0 | 0 | 0.0 |
| Year and Month b | All Routes | Persian Gulf | Soviet Far East | North Russia | Black Sea | Soviet Artic | |||||
|---|---|---|---|---|---|---|---|---|---|---|---|
| Tons | Percent of Total | Tons | Percent of Total | Tons | Percent of Total | Tons | Percent of Total | Tons | Percent of Total | ||
| 1945 | 3,673,819 | 44,513 | 1.2 | 2,079,320 | 56.6 | 726,725 | 19.8 | 680,723 | 18.5 | 142,538 | 3.9 |
| January | 405,762 | 31,454 | 7.8 | 194,914 | 48.0 | 118,869 | 29.3 | 60,525 | 14.9 | 0 | 0.0 |
| February | 450,588 | 4,497 | 1.0 | 181,741 | 40.3 | 153,278 | 34.0 | 111,072 | 24.7 | 0 | 0.0 |
| March | 487,030 | 4,409 | 0.9 | 161,786 | 33.2 | 148,731 | 30.5 | 172,104 | 35.4 | 0 | 0.0 |
| April | 540,278 | 1,232 | 0.2 | 193,709 | 35.9 | 167,180 | 30.9 | 178,157 | 33.0 | 0 | 0.0 |
| May | 768,295 | 2,921 | 0.4 | 518,212 | 67.4 | 138,667 | 18.1 | 108,495 | 14.1 | 0 | 0.0 |
| June | 329,191 | 0 | 0.0 | 275,018 | 83.5 | 0 | 0.0 | 21,638 | 6.6 | 32,535 | 9.9 |
| July | 408,554 | 0 | 0.0 | 313,360 | 76.7 | 0 | 0.0 | 1,268 | 0.3 | 93,926 | 23.0 |
| August | 234,606 | 0 | 0.0 | 200,369 | 85.4 | 0 | 0.0 | 18,160 | 7.7 | 16,077 | 6.9 |
| September | 49,515 | 0 | 0.0 | 40,211 | 81.2 | 0 | 0.0 | 9,304 | 18.8 | 0 | 0.0 |
a Represents total shipments from the Western Hemisphere, principally leand-lease supplies, including goods for Canadian and
accounts.
Includes approximately 488,000 tons lost en route, principally in 1942.
Does not include some 555,000 long tons of Petrol products originating at, replaced by allocations from
supplies for
Does not include quantities of supplies originally shipped to
b Represents date of departure from Western Hemisphere ports.
c Less than 0.05 percent.